
Asides from performance and resilience benefits, routing backend services through Octoparts gives you the benefit of effortlessly* having the metrics for all of them in one place. Visualisations are available in Kibana and/or Hystrix dashboard and/or Zipkin.
*Some assembly is required.
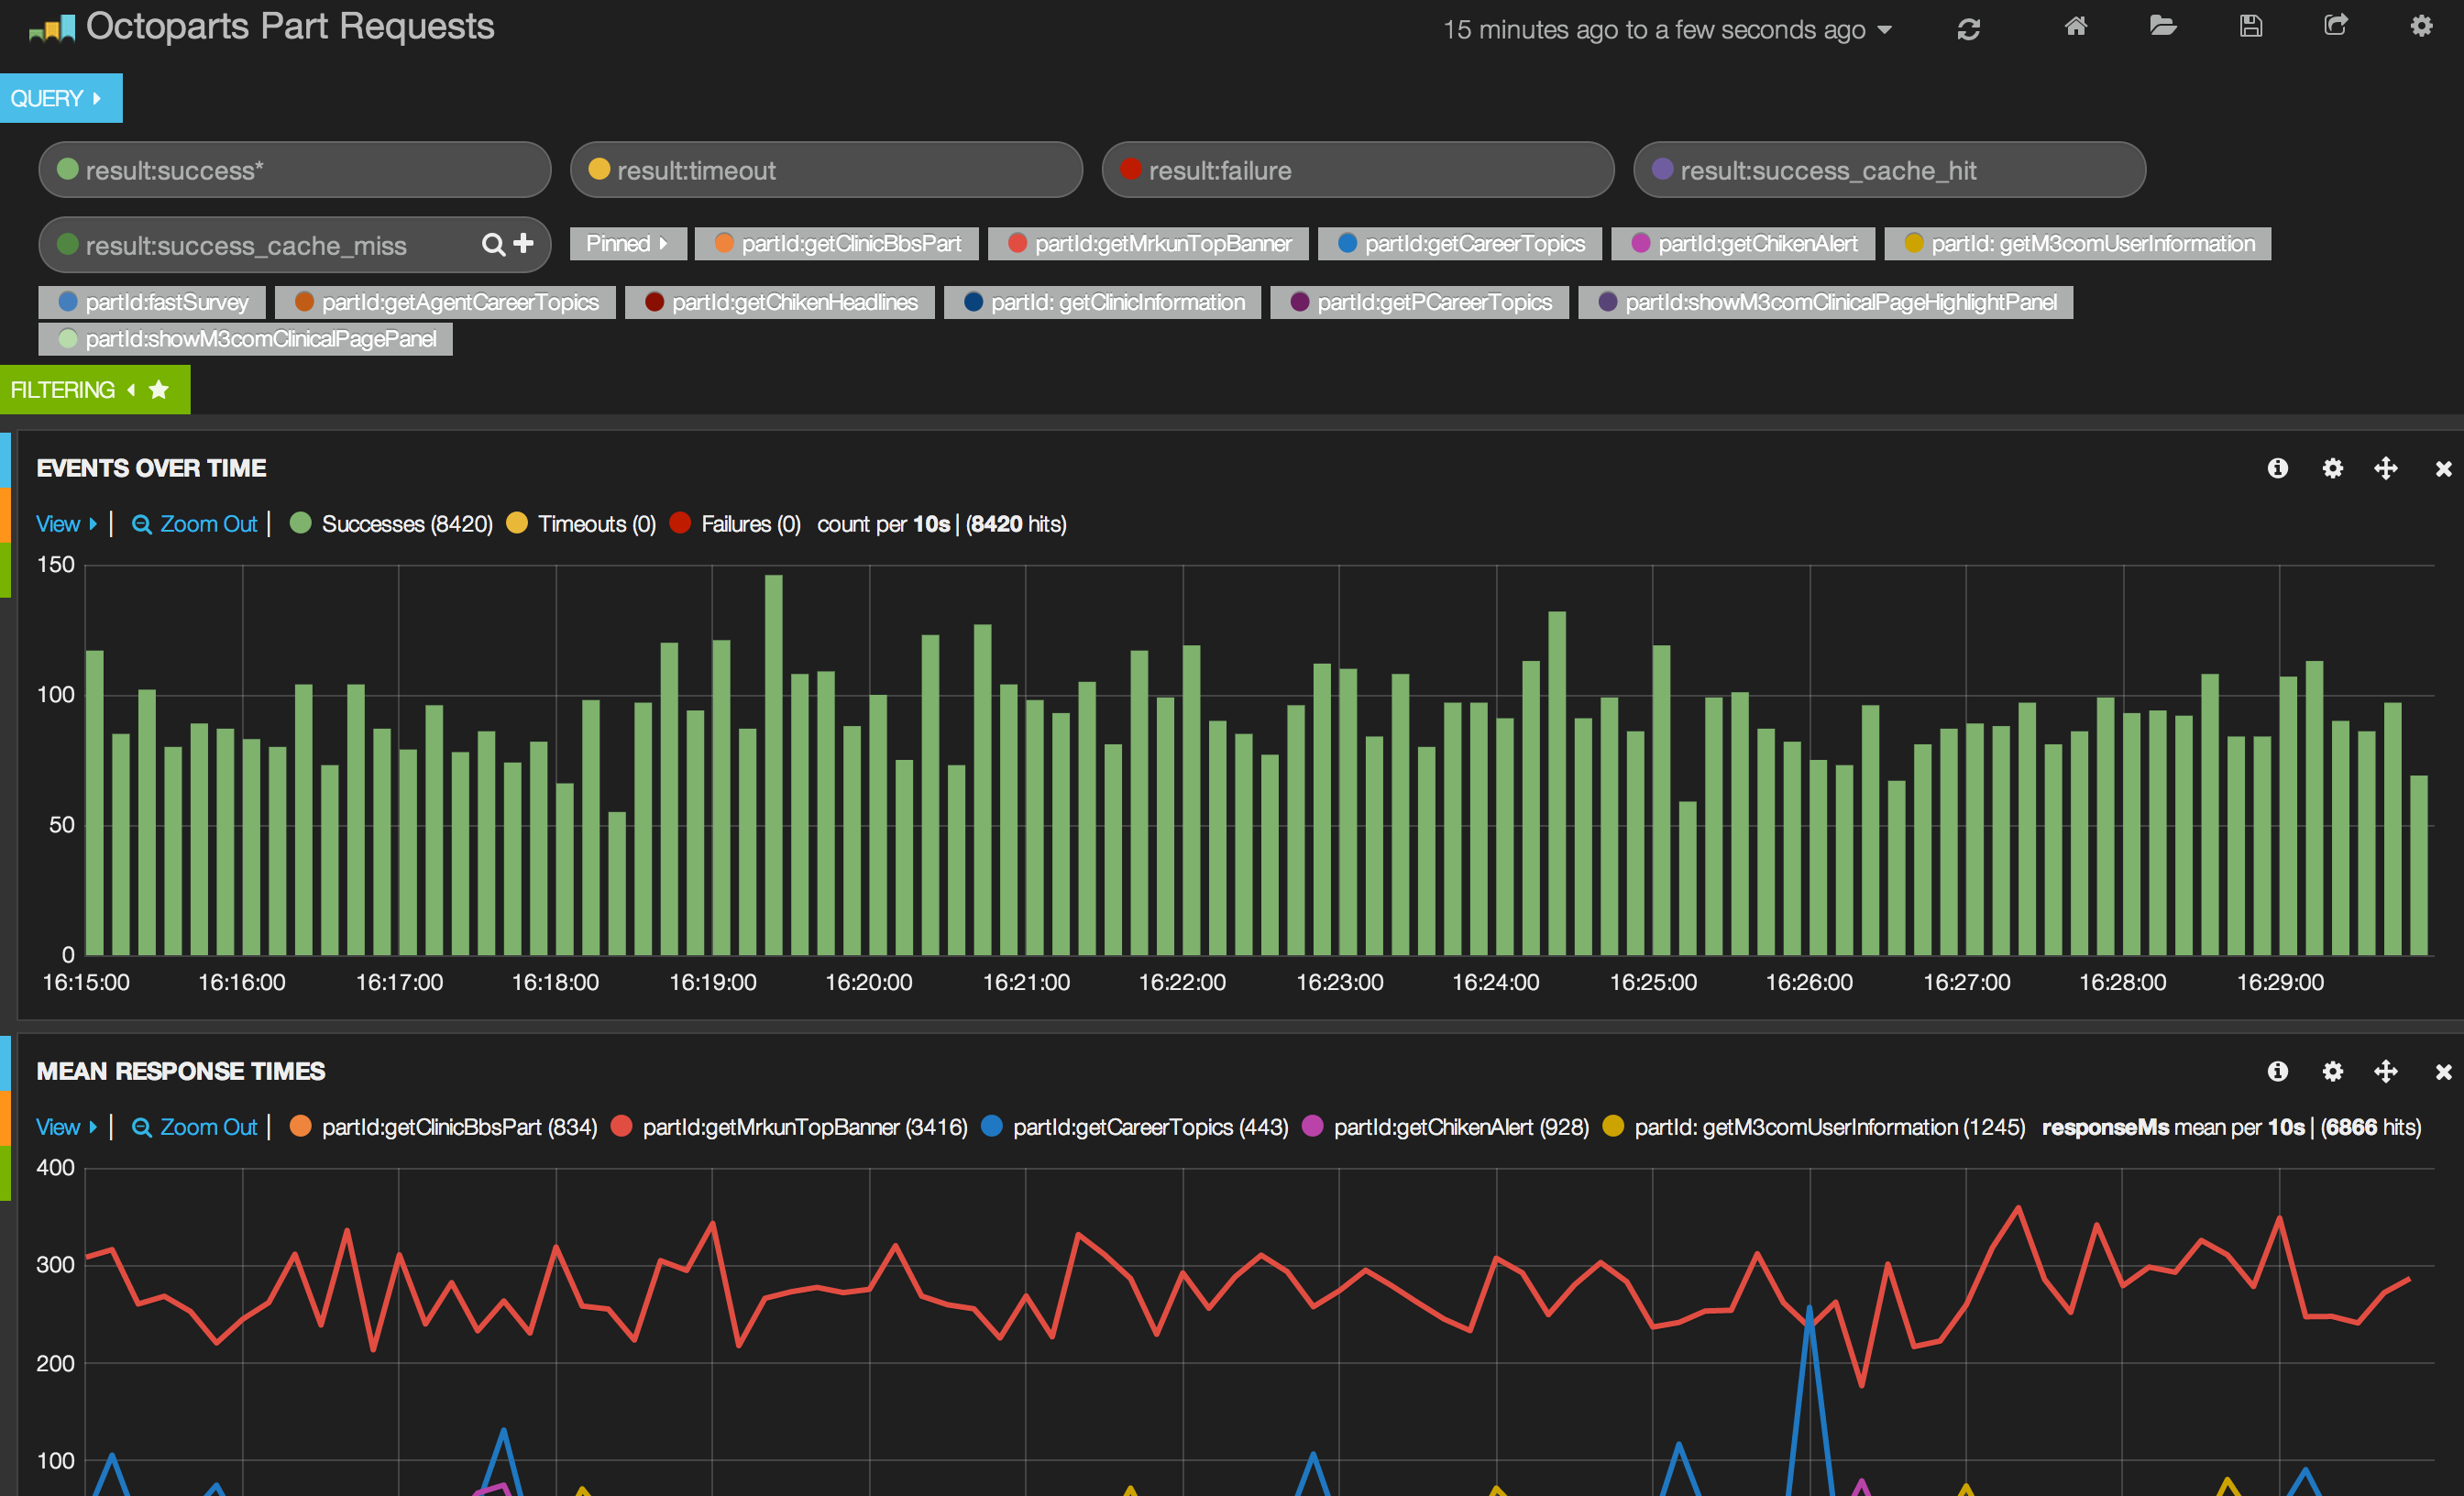
Octoparts is configured to log metadata for all backend endpoint requests. This includes when a request occured, endpoint id, cache hit or miss, and response time. It also logs Hystrix statuses for the endpoint separately, showing whether the circuit was open or closed, error counts, and average execution time.
This data is logged in LTSV format and we will use Fluentd to help us get the data from our Octoparts nodes to Elasticsearch so it is accessible from Kibana.
If you already know how to set up Fluentd, feel free to do it Your Way.
td-agent packagelibcurl-devel packagefluent-plugin-elasticsearch gem: $ fluent-gem install fluent-plugin-elasticsearch Note: this is fluent-gem install not gem install/etc/td-agent/tmp/etc/td-agent/td-agent.conf with the following contents ## You will want to substitute your actual Octoparts log directory, Elasticsearch host, and
## Elasticsearch host port in the appropriate placeholders below.
####
## Output descriptions:
##
## match tag=debug.** and dump to console
<match debug.**>
type stdout
</match>
####
## Source descriptions:
##
<source>
type tail
format ltsv
path {{ octoparts_log_dir }}/hystrix-metrics.log
pos_file /etc/td-agent/tmp/hystrix-metrics.pos
tag octoparts.hystrix
time_key time
</source>
<source>
type tail
format ltsv
path {{ octoparts_log_dir }}/part-requests.log
pos_file /etc/td-agent/tmp/part-requests.pos
tag octoparts.partrequests
time_key time
</source>
<match octoparts.hystrix>
type elasticsearch
host {{ elasticsearch_host }}
port {{ elasticsearch_port }}
type_name metrics
logstash_format true
logstash_prefix octoparts_hystrix
flush_interval 5s
utc_index false # Convert UTC timestamps to Japanese timezone
</match>
<match octoparts.partrequests>
type elasticsearch
host {{ elasticsearch_host }}
port {{ elasticsearch_port }}
type_name partrequests
logstash_format true
logstash_prefix octoparts_partrequests
flush_interval 5s
utc_index false # Convert UTC timestamps to Japanese timezone
</match>
service td-agent start)You can install Elasticsearch using your distro’s package manager or the Elasticsearch official way. Just make sure it’s running before proceeding.
The official instructions are fairly straightforward and easy to follow. After you’ve gone through them, you should have a working Kibana deployment that can query your Octoparts log data stored in Elasticsearch and show nice pretty graphs.
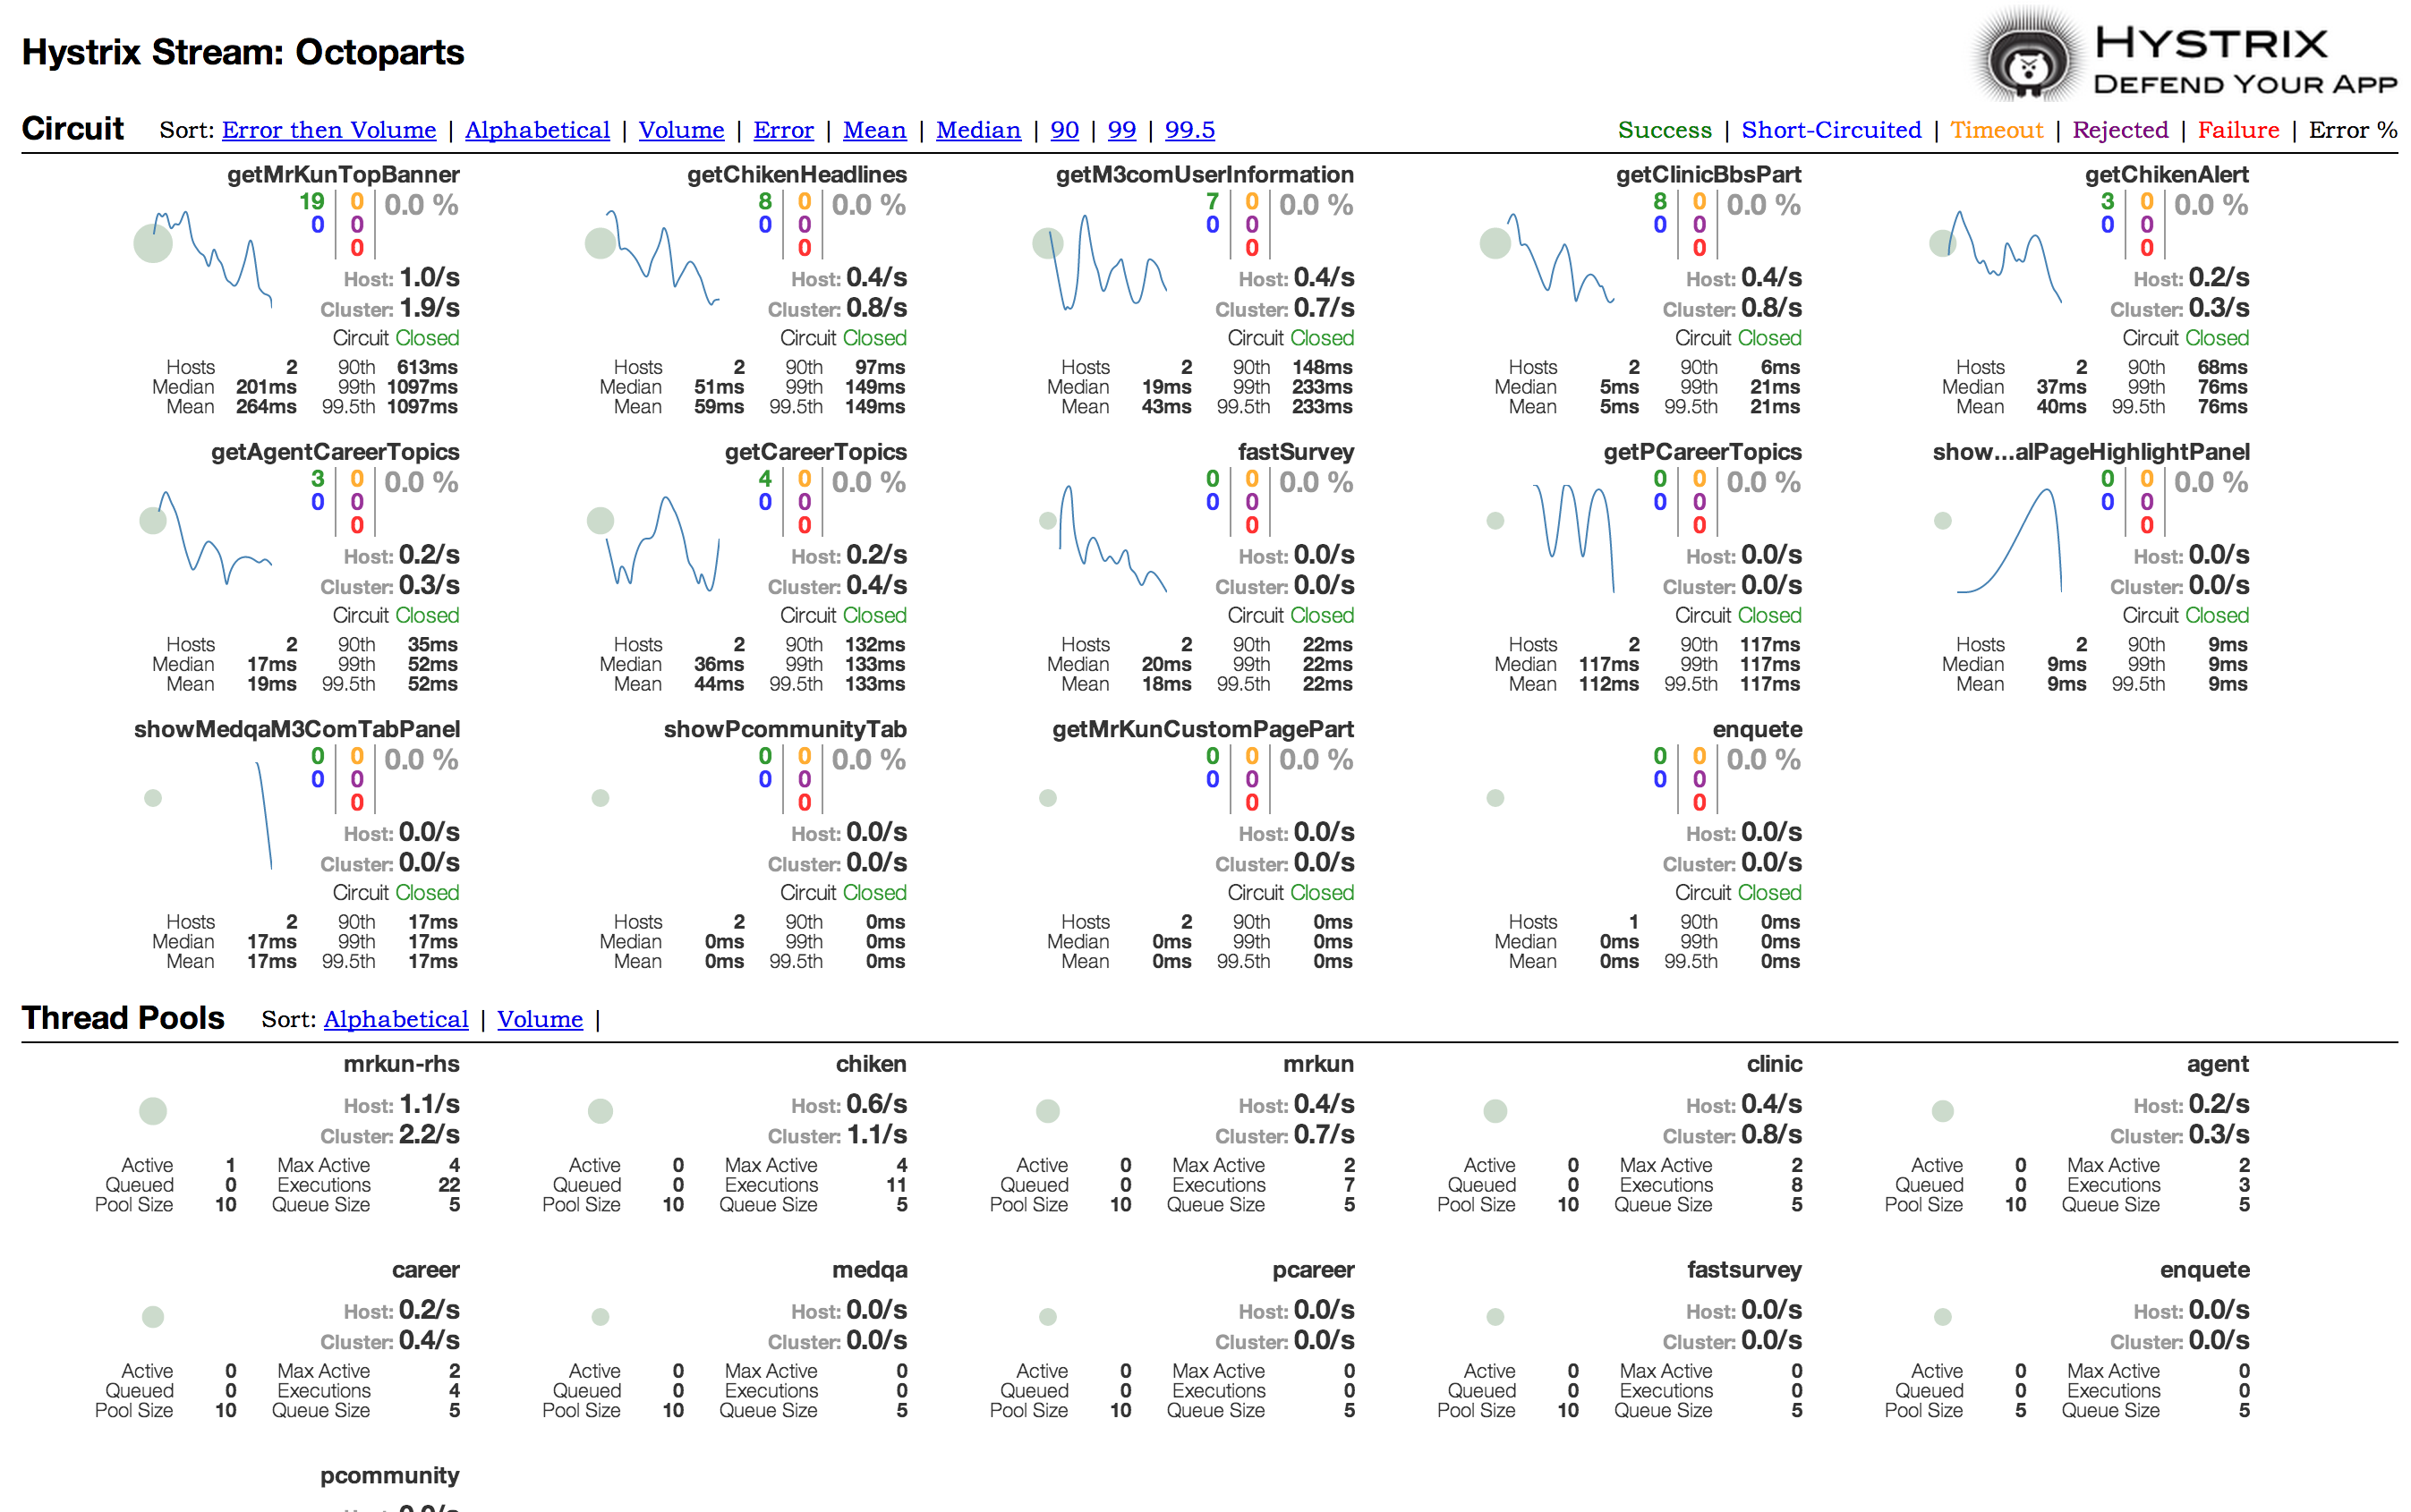
To visualise the real-time Hystrix data stream, we recommend using the Hystrix dashboard made by the Netflix team. The installation, which consists of installing Tomcat and deploying their prepackaged WAR file, is fairly simple and can be found on their Github wiki
Once the dashboard has been deployed, open a browser and go to where you’ve deployed it. At the Hystrix Dashboard greeting splash page, input your Octoparts web app address followed by /hystrix.stream (e.g. “http://octoparts/hystrix.stream”) into the top-most box and hit the “Monitor Stream” button. The next page will be blank until one of your endpoints is invoked.
If you have a cluster of Octoparts web apps running, you will need to aggregate the data streams from all your Octoparts nodes and feed an aggregated data stream to the Hystrix dashboard. Fortunately, Turbine (also made by Netflix) does exactly this.
The installation instructions for Turbine are located on their wiki, so we won’t repeat them here. We will say though, that we had no problems installing the Turbine WAR in the same Tomcat container installation as the Hystrix dashboard mentioned above.
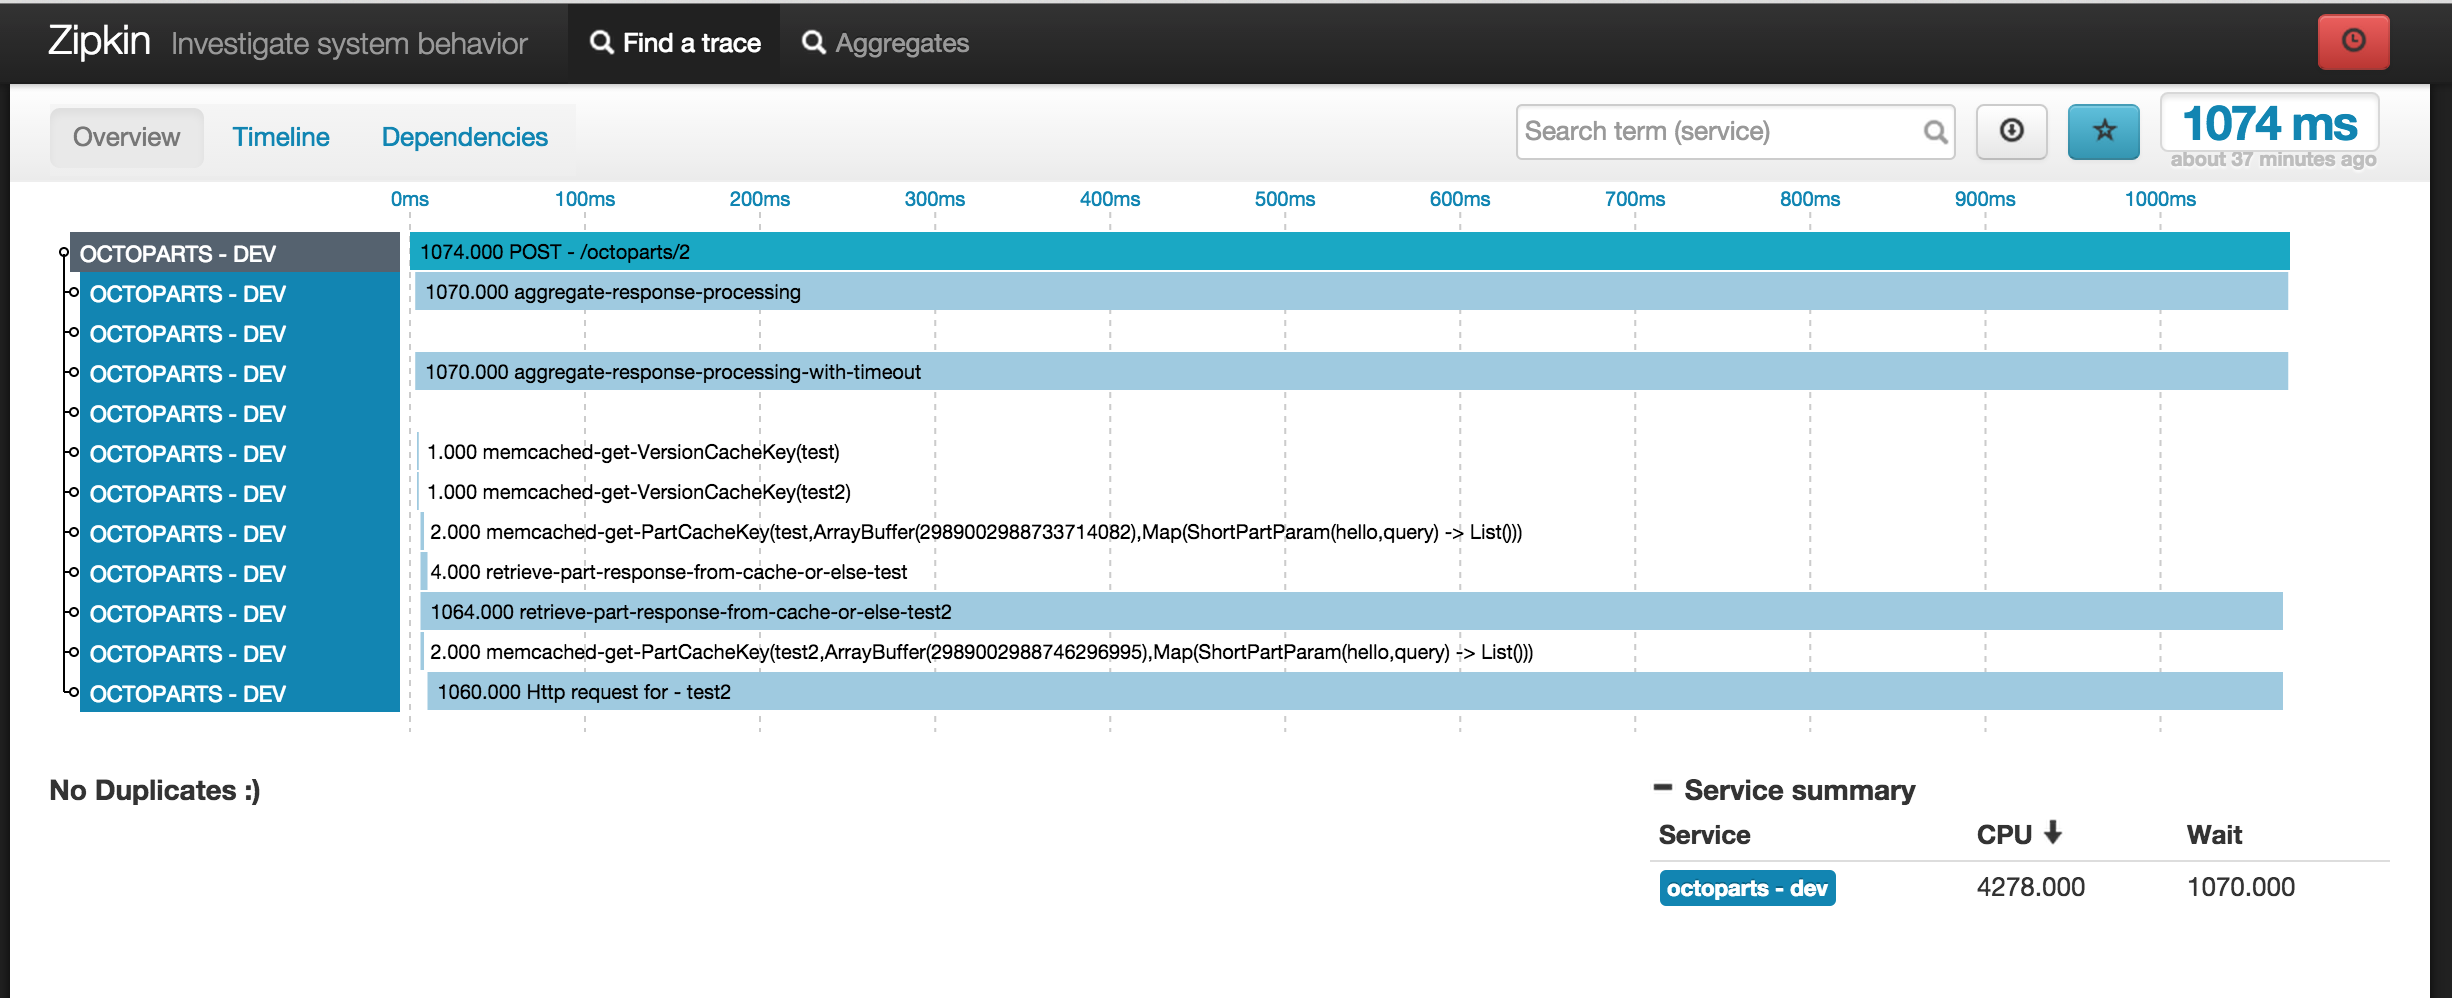
Assuming you have Zipkin set up (if you don’t, check out the official Quickstart guide), you can have Octoparts send Server/Client Sent/Received events to your Zipkin collector by setting OCTOPARTS_ZIPKIN_HOST and OCTOPARTS_ZIPKIN_PORT environment variables.
Spans logged to Zipkin will include: - Overall server request times - Memcached access times - DB access times - HTTP request wait times
Octoparts will also play nice with the rest of your Zipkin-enabled infrastructure, meaning it will properly respect Zipkin ids sent to it in HTTP headers (it will set the parent-id of it’s Server Spans to be the client span id sent to it and maintain the same trace-id) and it will forward Zipkin headers to any HTTP endpoints it calls. This ensures that you can have 1 big trace from beginning to end, allowing you to pinpoint/track bottlenecks in your distributed systems.
Next: Read about Octoparts’ Internals